In-App Trends View
This is the app's Trends plot showing low-frequency hearing threshold over time. The blue line is the average of the 200 Hz, 300 Hz, and 500 Hz hearing thresholds for the left ear. Medication periods (Betahistine and Pycnogenol) are shown as colored bands, and individual vertigo episodes are marked with vertical green lines.
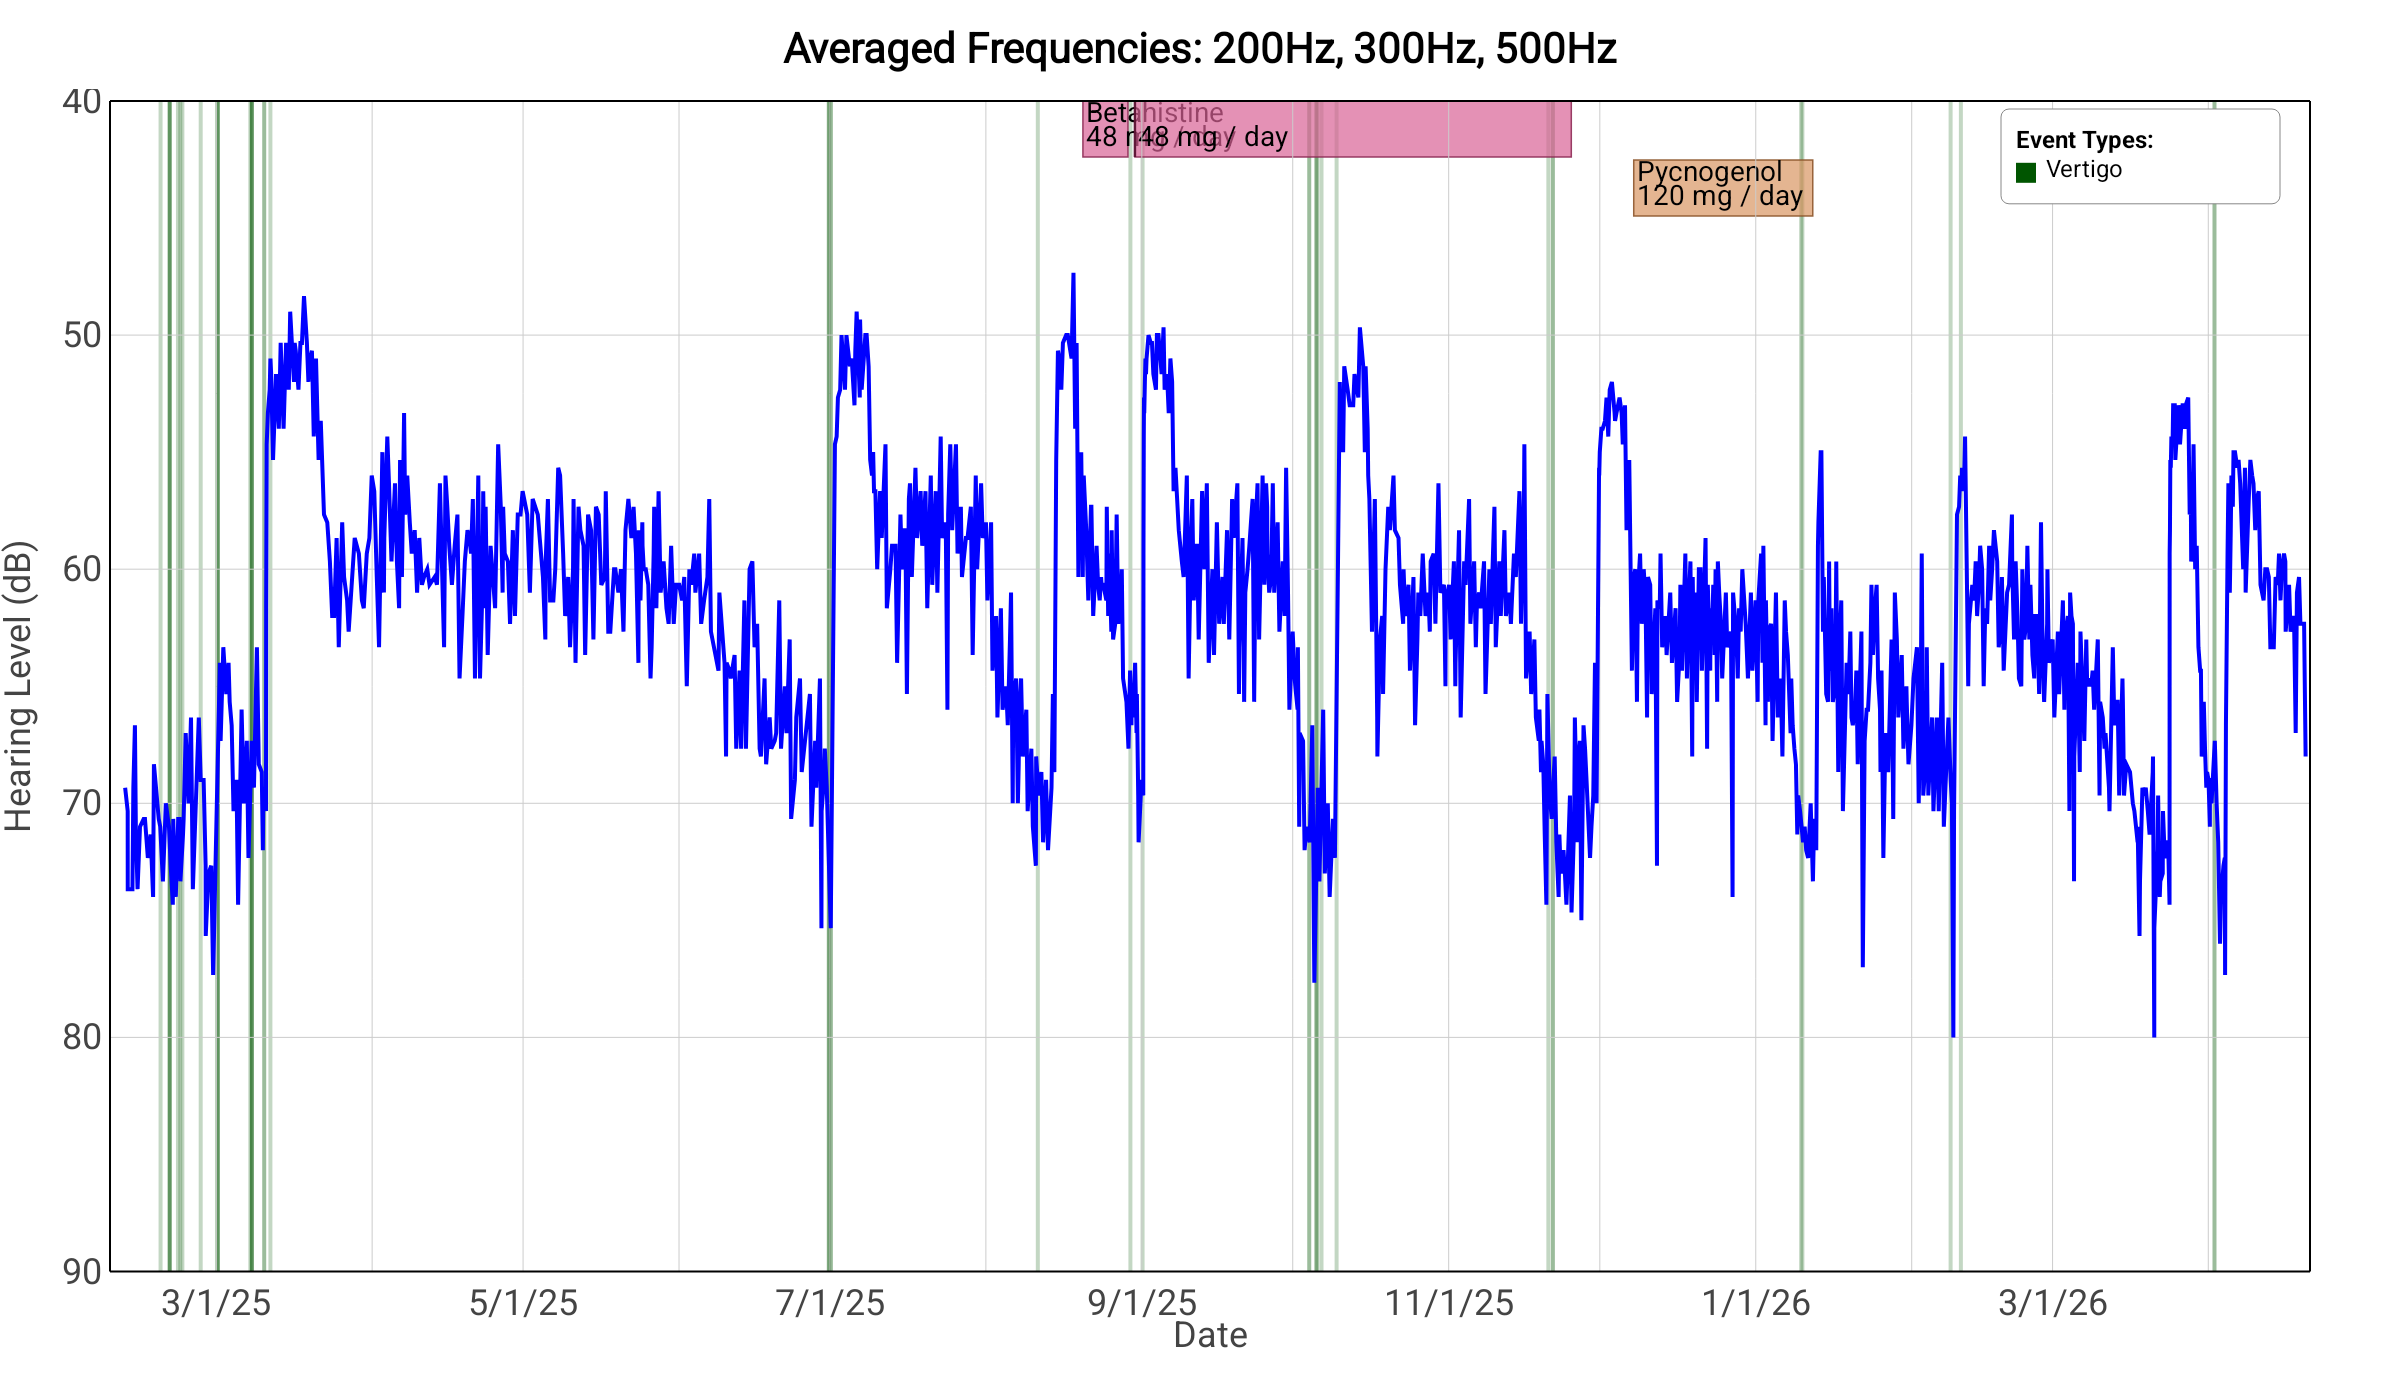
Averaged 200–500 Hz hearing thresholds, February 2025 – April 2026. Blue line is left-ear low frequency hearing level. Medication periods shown as colored bands; vertigo episodes as vertical lines.
Starting at the left side of this plot, around February and March of 2025, there was a period of particularly poor hearing and frequent vertigo. In early March there was a sudden hearing improvement, with the hearing level jumping from about 70 dB to about 50 dB, and the end of the period of frequent vertigo. Hearing remained at this elevated level for about a week before declining to about 60 dB, where it stayed for close to two months, until early June when it started slowly declining to about 70 dB, at which point vertigo again appeared. Fortunately this time the period of vertigo was brief with just a couple vertigo episodes (not resolvable on the plot). The pattern repeats throughout the year: 1) a period of "normal" hearing, about 60 dB, 2) a decline to about 70 dB, 3) a period of frequent vertigo, and 4) a jump to about 50 dB that lasts roughly a week. The hearing level associated with these pattern segments remains mostly constant, though the durations of the segments varies. There was a small general decline over the year: the "normal" segment around the end of 2025 is a few dB below the "normal" observed in April and May of 2025. Furthermore, the pattern that was very clear in 2025 is less clear so far in 2026. This could be the general variability or progression of the disease, or a result of having tried Betahistine and Pycnogenol around or a little before the time those pattern variations appeared.
In addition to providing insight into the behavior of the disease, the above plot provides one valuable practical benefit: it gives the patient some warning of when vertigo episodes are likely. In nearly all cases over the observed year vertigo only occurred following a decline in hearing from the normal 60 dB to around 70 dB. So when hearing is around the 70 dB level, vertigo is likely. When hearing is at the 60 dB normal level or the 50 dB elevated level, vertigo is very unlikely. This alleviates some of the anxiety caused by the unpredictable nature of Meniere's vertigo attacks. Note that this may only apply to this one patient, and that during a down period -- with hearing around the 70 dB level -- it does not predict the timing of individual vertigo attacks, only that vertigo attacks are likely.